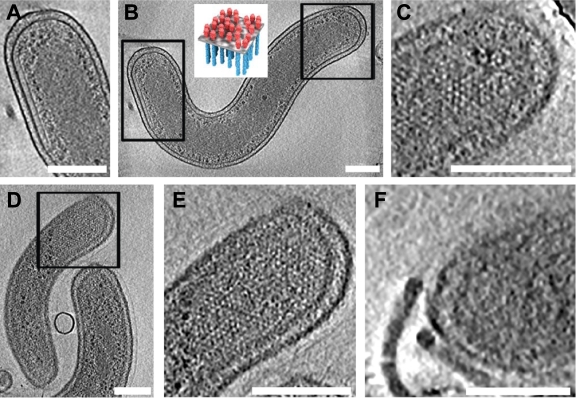
FIG. 5.
Flagellar assembly and localization of the receptor arrays at the poles of MreB2-mTFP cells in 21-nm-thick tomographic slices. Expanded views of polar chemoreceptor arrays shown from the side (A) or the top (C) encompass the rectangular boxed areas that are indicated on the cell shown in panel B. The top view is of a tomographic section that contains the surface region of the bacterium; the receptors are visualized as white dots while the receptor array of the side view forms a thin line under the inner cell membrane. (Inset) Schematic model of chemoreceptor arrays to illustrate top and side views, reprinted from the work of Khursigara et al. (26). Another cell contains a large chemotaxis receptor cluster, which is shown in a top view in panel D and magnified in panel E. (F) Two closely spaced, intact flagella are evident at the pole of a third cell, shown in a 10.4-nm tomographic slice. Bar, 200 nm.

