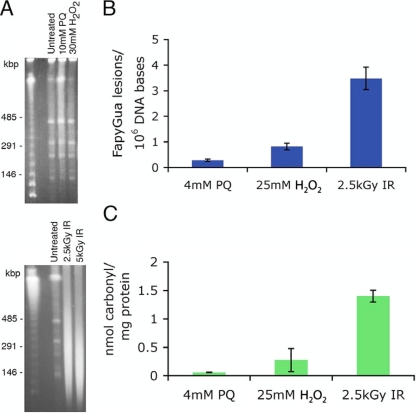
FIG. 1.
Quantification of cellular lesions in H. salinarum Δura3 cells exposed to H2O2, paraquat, and IR. (A) DNA DSBs were visualized by PFGE; samples were taken before (untreated) and following treatments with H2O2, paraquat, and IR and then embedded in InCert agarose plugs at a final density of 1× 10⁹ cells/ml; the plugs were digested with XbaI prior to gel electrophoresis. The first lanes are molecular size ladders. (B) The level of modified base FapyGua was measured using GC-MS with isotope dilution; the numbers of FapyGua lesions per 106 DNA bases were background subtracted. (C) Protein carbonyl residues were quantified by immunodetection; the nmol of carbonyl residues per mg of proteins was background subtracted. All data shown are the average results of at least three replicates; the uncertainties are standard errors.

