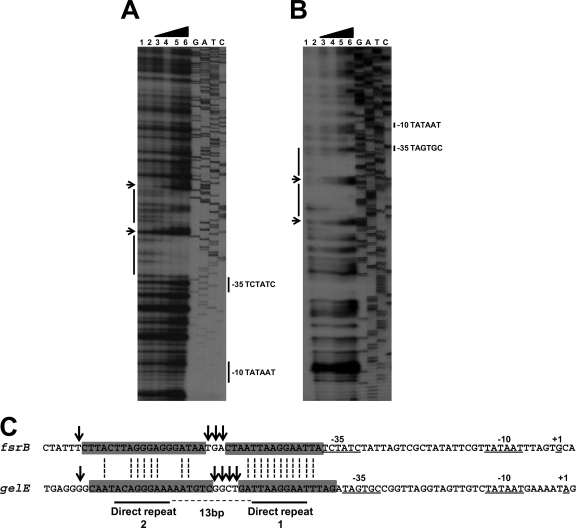
FIG. 3.
DNase I footprinting analysis of the promoter-regulatory regions of fsrB (A) and gelE (B). The labeled DNA fragments were obtained as described in Materials and Methods. The fragments were incubated with different amounts of FsrA-His6 before DNase I treatment. Protein concentrations used in each reaction mixture were 0 (lanes 1 and 2), 0.66 μM (lane 3), 1.3 μM (lane 4), 2.6 μM (lane 5), and 5.3 μM (lane 6). Dideoxy sequencing reactions of pTOPO-fsrB (A) and pTOPO-gelE (B) are also shown. (C). Alignment of the nucleotide sequence of the fsrB and gelE promoters identifying the regions protected by FsrA and the −10 and −35 promoter elements (26). Regions protected from DNase I digestion are indicated by gray boxes. Arrows show nucleotides hypersensitive to DNase I digestion. The direct repeats shown are based on the consensus sequence identified in Fig. 4.

