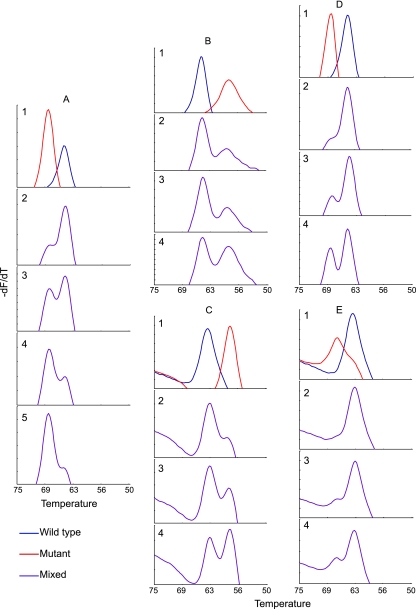
Fig. 2.
Tm profiles of DNA mixtures. The Tm curve for the indicated SMB is shown in an assay containing various mixtures of wild-type and mutant clinical M. tuberculosis DNA. (A) SMB QDR1 tested with wild-type plus D94G mutant DNA. Panel 1, individual wild-type and mutant DNA samples; panel 2, 5% mutant and 95% wild-type DNA; panel 3, 10% mutant and 90% wild-type DNA; panel 4, 20% mutant and 80% wild-type DNA; panel 5, 30% mutant and 70% wild-type DNA. (B) SMB QDR1 tested with wild-type plus S91P mutant DNA; (C) SMB QDR2 tested with wild-type plus S91P mutant DNA; (D) SMB QDR1 tested with wild-type plus A90V mutant DNA; (E) SMB QDR2 tested with wild-type plus A90V mutant DNA. In panels B to E, panel 1 contains individual wild-type and mutant DNA samples, panel 2 contains 10% mutant and 90% wild-type DNA, panel 3 contains 20% mutant and 80% wild-type DNA, and panel 4 contains 30% mutant and 70% wild-type DNA. All of the wild-type and mutant DNA had the gyrA(95T) allele.

