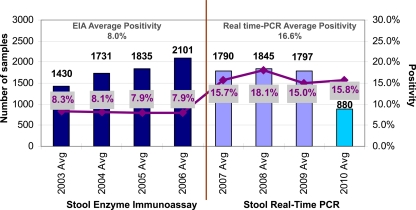
Fig. 1.
Annual volumes and positivity rates from 2003 to 2010. While the overall C. difficile test volume has remained constant, positivity rates following the implementation of real-time PCR testing have doubled compared to prior positivity results obtained by EIA. The vertical line in the center denotes the transition to real-time PCR testing. Note that the volumes for 2010 refer to testing through 31 May 2010.

