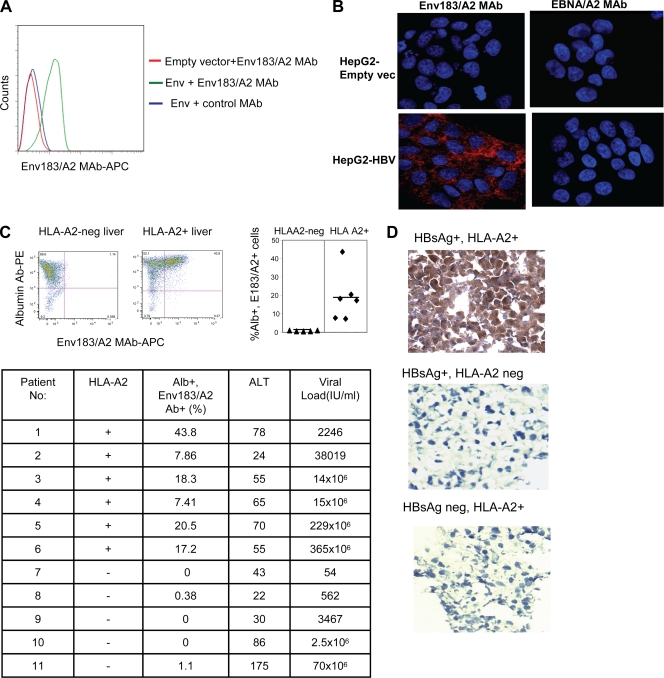
FIG. 3.
Recognition of pMHC complexes on HBV-infected cells. (A) HepG2 cells were transduced with empty vector or HBsAg. Forty-eight hours after transduction, cells were stained with Env183/A2 MAb or a control EBNA/A2 MAb as described above. Data show results of a typical experiment out of three experiments. (B) Visualization of the pMHC complex. HBV-producing HepG2-117 cells or control HepG2 cells were fixed with 1% PFA and stained with 1 μg of Env183/A2 MAb or a negative control EBNA/A2 MAb overnight at 4°C. An Alexa Fluor 647-tyramide signal amplification kit was used to visualize antibody binding (red). Nuclei were stained with DAPI (blue). (C) Recognition of the pMHC complex on cells obtained from liver biopsy specimens from CHB patients. Dot plots represent liver-derived cells obtained from biopsy specimens of two representative CHB patients (one HLA-A2+ and one HLA-A2 negative) stained with albumin (Alb) Ab and Env183/A2 MAb. Percentages displayed in the upper right quadrant indicate the number of cells positive for both Abs (left). The quadrant gates were set for each patient's cells stained with isotype control antibodies. The scattered diagram shows the frequency of Env183/A2 MAb and albumin Ab double-stained cells obtained from various patient biopsy specimens (right, P < 0.01). The table indicates the total number of patients tested, Env183/A2 MAb and HLA-A2 positivity, and clinical/virological features of the 11 distinct CHB patients. ALT, alanine aminotransferase. (D) Cryostat sections of liver biopsy specimens (HBV status and HLA typing are indicated) were stained with antibodies as described above (B). An EnVision Plus mouse HRP polymer kit was used to reveal primary antibody staining (brown). Nuclei were counterstained with hematoxylin (blue).

