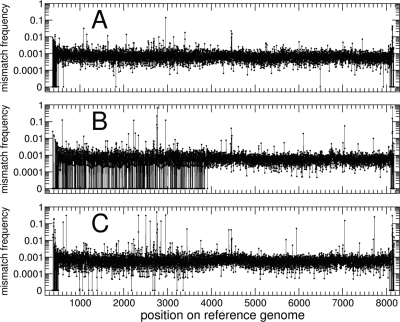
FIG. 3.
Frequencies of mismatches (second data set) obtained by aligning the reads to the reference genome. (A) Inoculum; (B) FLF sample; (C) BRF sample. The second data set had a higher level of coverage than the first one, with a smaller fraction of sites with no mismatches. The average mismatch frequency is very similar to that of the first data set.

