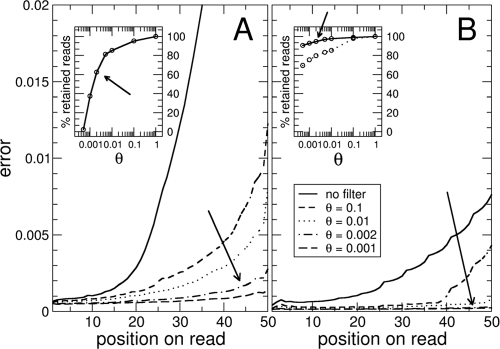
FIG. A1.
Average errors in reads, computed with base qualities. (A) First data set; (B) second data set. The average error increased greatly towards the ends of the reads (solid lines). The second data set was less noisy. Different filtering strategies were tested, and only reads whose average error was below a threshold θ value were accepted. More-stringent thresholds decreased the errors in the reads (small dashed, dotted, dotted-dashed, and dashed lines). The insets show the fractions of reads retained after the filtering process (using a threshold θ value of 0.2%), including 66% of the reads in the first data set and 95% of the reads in the second data set.

