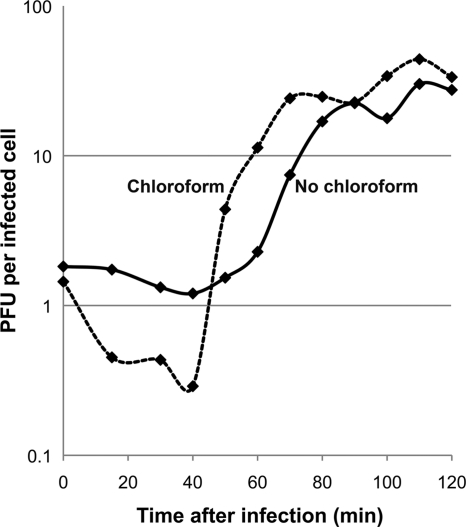
FIG. 2.
One-step growth curve of Syn5. The two data sets represent samples treated with chloroform (dashed line) and samples without chloroform (solid line) after collection. The cultures (before and after infection) were incubated at 28°C under 45 to 50 μmol m−2 s−1 of light irradiation. Each curve represents average results from three experiments.

