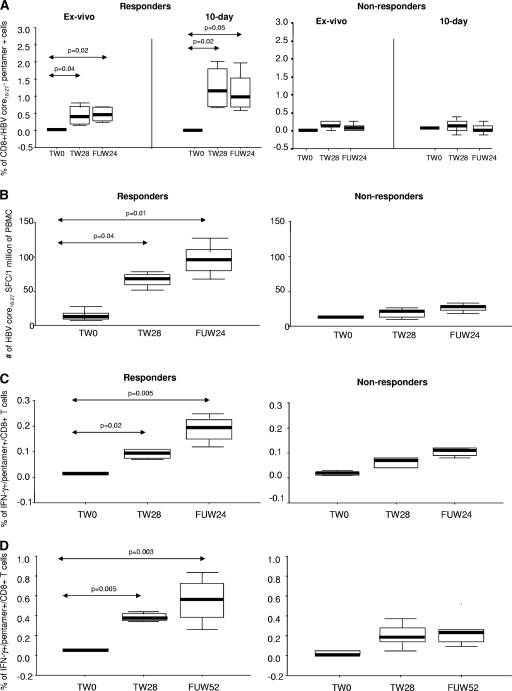
FIG. 3.
HBV-specific T-cell immune responses. (A) Frequency of CD8+ T cell HBV core18-27 pentamer+ ex vivo and after 10-day incubation. (B) Numbers of HBV core18-27-specific CD8+ T cells producing IFN-γ (ELISPOT). (C) Frequency of HBV core18-27 pentamer+/CD8+ T cells producing IFN-γ ex vivo. (D) Frequency of HBV core18-27 pentamer+/CD8+ T cells producing IFN-γ after stimulation with HBV core18-27 peptide. Horizontal black bars and error bars represent median and interquartile ranges, respectively.

