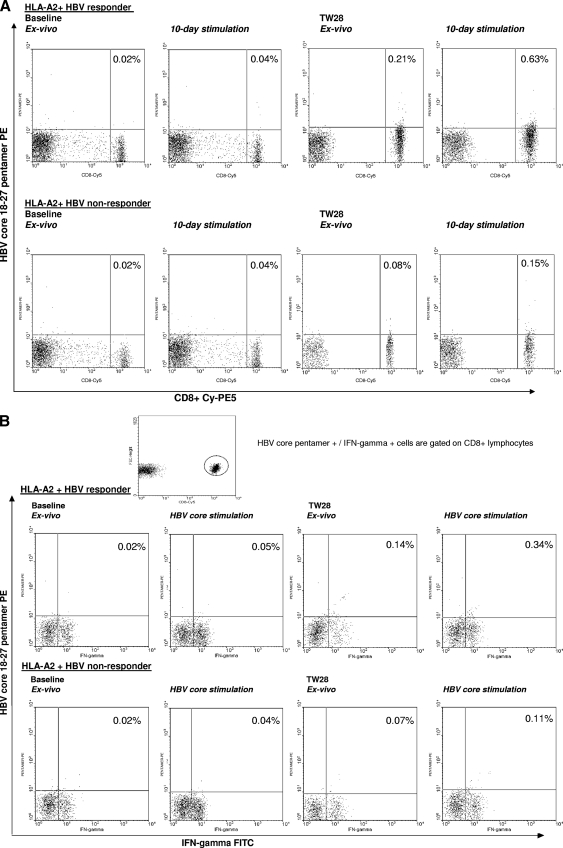
FIG. 4.
(A) Flow cytometry plots of HBV core18-27 pentamer staining in two representative patients. (Top row) HLA-A2-positive responder. (Bottom row) HLA-A2-positive nonresponder. Vertical axis, HBV core18-27 pentamer-PE; horizontal axis, anti-CD8-Cy-PE5. (B) Flow cytometry plots of IFN-γ-secreting CD8+ HBV core18-27 pentamer-positive cells from two representative patients. (Top row) HLA-A2-positive responder. (Bottom row) HLA-A2-positive nonresponder. Vertical axis, HBV core18-27 pentamer-PE; horizontal axis, anti-IFN-γ-fluorescein isothiocyanate (FITC).

