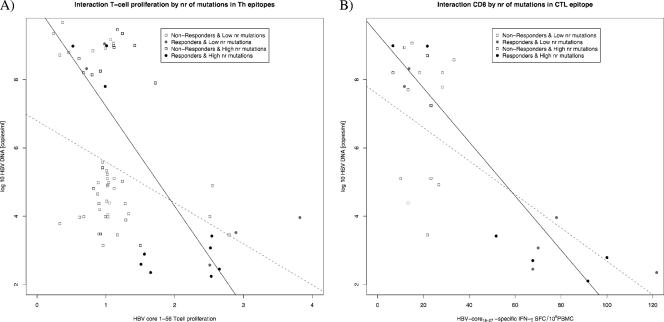
FIG. 8.
Interaction plots between T helper epitope mutations and T-cell proliferation (A) and between T cytotoxic epitope 18-27 mutations and HBV-specific CD8+ immune responses in relation to the HBV-DNA viral load (copies/ml) (B). The black dots, squares, and regression lines represent individuals with a number of mutations smaller than the mean at baseline, and those in gray represent individuals with a number of mutations higher than the mean at baseline. Data points are given for all individuals across all time points.

