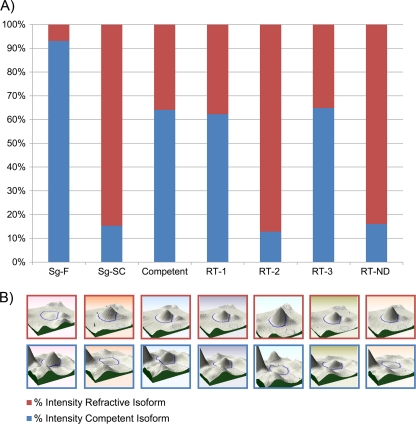
FIG. 4.
Three patterns of protein isoform expression were observed in the parent and F2 S. graminum genotypes. (A) Expression (y axis) of one isoform pair, dihydropteridine reductase, in the parents, a competent F2 genotype, and each type of refractive F2 genotype. The Sg-F isoform (blue) and the Sg-SC isoform (red) segregate in the F2 population as allelic variants. The percent intensity of each isoform was calculated by dividing the intensity of each isoform by the summed total intensity for the total protein produced from the locus. F2 genotypes expressing both isoforms expressed each isoform at a lower level than that in genotypes expressing only one isoform. (B) 3-D gel spot image of each isoform in the pair.

