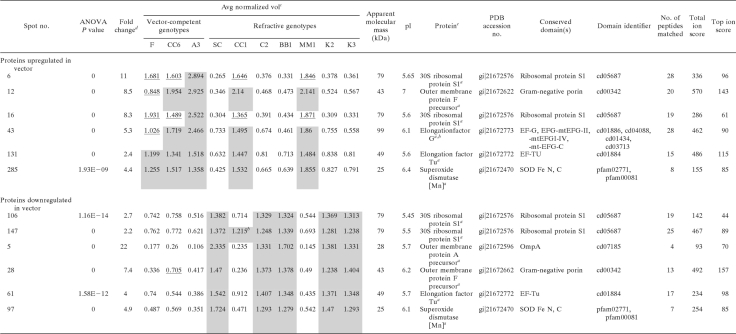
TABLE 3.
Buchnera proteins differentially expressed between transmission-competent and refractive Schizaphis graminum genotypes
a Method of protein identification, MALDI MS-MS/MS.
b Average normalized values were elevated but not statistically significant.
c Mean separations of log-normalized volumes are shown via shading and underlining, with shading indicating higher expression levels on a spot-by-spot basis (ANOVA P values, <0.05). Sample spot volumes were normalized using a background-adjusted abundance ratio to the Cy2 internal standard and were adjusted by a gain factor calculated for each sample.
d The fold change value reported is the maximum change between the mean normalized volumes between genotypes.
e Isoform pairs are spots 6/12 and 106/147, spots 12 and 28, spots 131 and 61, and spots 285 and 97.

