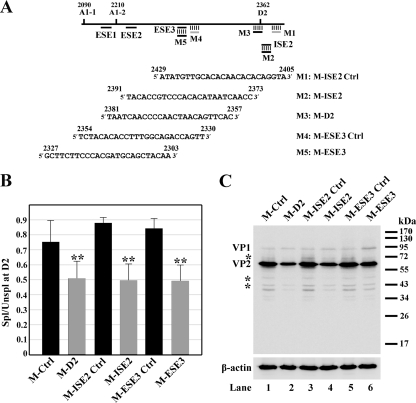
FIG. 4.
ESE3- and ISE2-mediated enhancement of splicing during B19V infection as assessed by a morpholino approach. (A) Top, B19V exon 2 is depicted with the positions of splice sites and targets of the morpholino oligonucleotides indicated. Bottom, sequences of the morpholino antisense oligonucleotides used in this experiment. (B and C) Morpholino oligonucleotides inhibited splicing of the B19V pre-mRNA at the D2 site. For these experiments, the CD36+ erythroid progenitor cells were expanded as previously described (6, 21). The cells were treated with morpholino oligonucleotides 16 h prior to B19V infection, as previously described (2). (B) At 48 h postinfection, mRNA was isolated from B19V-infected cells and quantified using qRT-PCR. The qRT-PCR method, primers, and probes for β-actin, VP2-encoding mRNA, and 11kDa-encoding mRNA have been described previously (7). For the VP1-encoding mRNA, the following primers and probe were used: forward primer, 5′-TGGGTTTCAAGCACAAGTAGTAAAA-3′; reverse primer, 5′-CCGGCAAACTTCCTTGAAAA-3′; and TaqMan probe, 5′-FAM-TGCAGCTGCCCCTGTGGCC-BHQ1-3′, where FAM is 6-carboxyfluorescein, and BHQ1 is black hole quencher 1. The absolute copy numbers of the B19V VP1 (R4+R5)-, VP2 (R6+R7)-, and 11kDa-encoding (R8+R9) mRNAs (Fig. 1) were obtained using the copy number of β-actin as an internal control. Results shown are averages and standard deviations from three independent experiments. ** denotes statistical significance (P value, <0.05) for the groups compared with their respective controls as well as M-Ctrl, a standard control oligonucleotide from GeneTools, LLC, as determined by the Student t test. The ratio of spliced to unspliced B19V mRNAs at the D2 site, as indicated by “Spl/Unspl,” was obtained by quantifying the numbers of copies of the unspliced VP1-encoding mRNA and the numbers of copies of the spliced B19V VP2- and 11kDa-encoding mRNAs. (C) At 48 h postinfection, cells were collected and analyzed by Western blotting using a monoclonal antibody against VP2 (clone R92F6; Millipore Co., MA) as described previously (14). Signals were developed using SuperSignal West Dura substrate (Thermo) and quantified with a Fujifilm LAS 4000 imager. Asterisks indicate degraded bands of VP1 and VP2.

