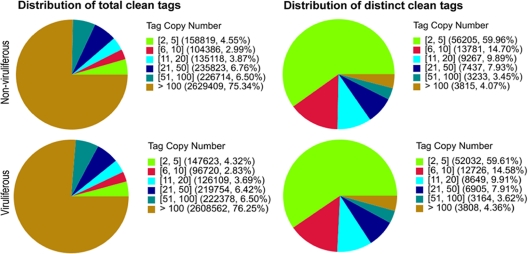
FIG. 1.
Distribution of total tags and distinct tags over different tag abundance categories. Numbers in square brackets indicate the range of copy numbers for a specific category of tags. For example, “[2, 5]” means all the tags in this category have 2 to 5 copies. Numbers in parentheses show the total tag copy number for all the tags in that category.

