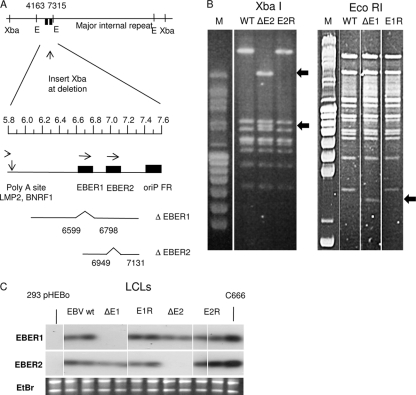
FIG. 1.
(A) Summary of EBER deletions introduced into EBV BAC. The relative positions of XbaI and EcoRI (E) restriction sites in the EBV genome are shown; the EcoRI sites at bases 4163 and 7315 flank the EBER genes, represented by the filled boxes. The part of the EBV genome between bases 5800 and 7600 is expanded below under a scale in kilobases. Below that, the EBV content of the targeting plasmids is shown; the deletion of EBER1 (bases 6599 to 6798) includes the EBER1 promoter and the EBER1 sequence. The EBER2 deletion (bases 6949 to 7131) just removes the EBER2 transcript sequence. In both mutants an XbaI site was introduced at the point of deletion to facilitate the analysis. (B) Restriction digestion of BAC DNA analyzed by pulsed-field gel electrophoresis. In the left panels, the XbaI site introduced at the EBER deletion point splits the largest XbaI fragment into two fragments (arrowed) in the XbaI digest; this example is EBER2 mutant and revertant BAC DNA recovered from transfected 293 cells. In the right panel, the EcoRI fragment (bases 4163 to 7315) containing the EBER genes is reduced in length in the EcoRI digest of the EBER1 deletion mutant (arrowed). The largest EcoRI and XbaI restriction fragments span the major internal repeat of EBV, and the similar sizes of these fragments in the parental (WT) and revertant (E1R and E2R) indicate that no loss of internal repeat sequences has occurred in the recombinations. (C) Northern blots of total RNA extracted from the indicated LCLs confirm the expected patterns of EBER expression. Negative control (293pHEBo) and positive control (C666.1) samples are indicated, and the corresponding ethidium bromide stain of rRNA is shown below to confirm equal RNA loading on the gels. Probe specific activities and hybridization efficiencies gave approximately equal signals for EBER1 and EBER2 on these blots.

