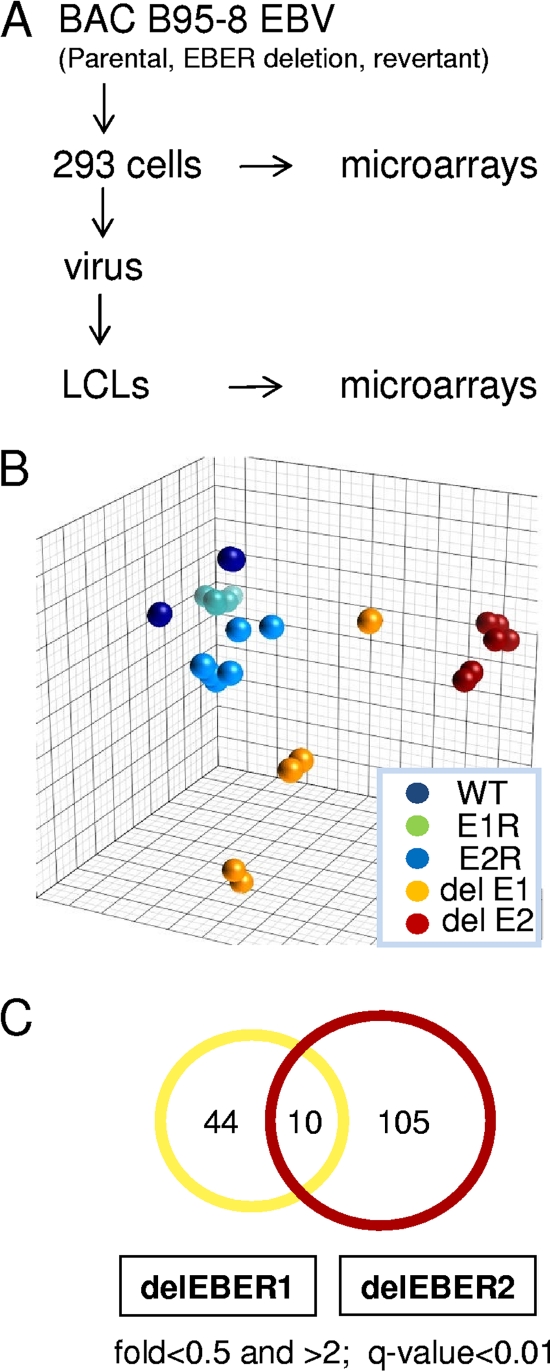
FIG. 3.
(A) Experimental design for microarrays. (B) Principal component analysis (Partek software) for differences in cell gene expression pattern comparing microarray data from LCLs containing parental EBV (WT), EBV with deletion of EBER1 (del E1), deletion of EBER2 (del E2), revertant of EBER1 deletion (E1R), or revertant of EBER2 deletion (E2R). (C) Venn diagram showing the number of EBER1 or EBER2 regulated genes.

