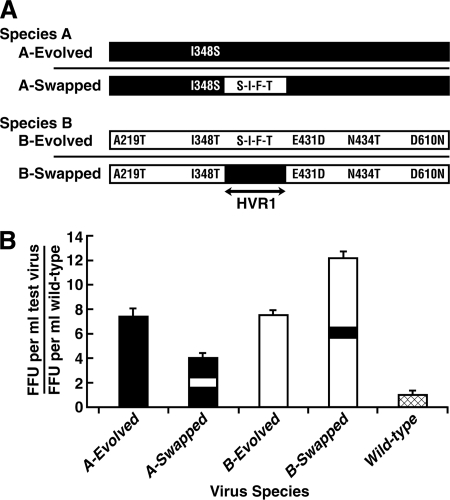
FIG. 3.
Effects of HVR1 sequence and non-HVR1 mutations on growth in Huh7.5 cells (A) Diagram of “evolved” species showing mutations that were selected during passage and were present in the backbone of the majority of genomes at the time of peak virus titer, and diagram of “swapped” species in which the HVR1 regions of species A and B were swapped by PCR mutagenesis. Species A and B sequences are shown in black and white, respectively. (B) Infectious viruses released into the medium at day 4 posttransfection were quantified (FFU) by a focus-forming assay. The wild-type 1a/2a chimera served as a standard and was assigned a value of 1. Species A and B regions are shown in black and white, respectively. Error bars show standard deviations.

