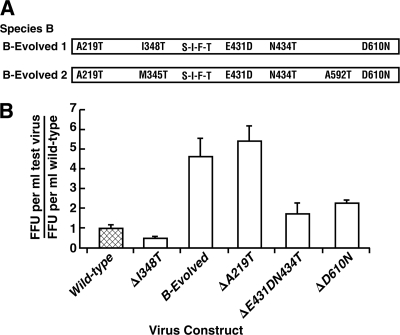
FIG. 4.
Effects of backbone mutations on growth of species B. (A) Diagram of backbone mutations present in the dominant B species at peak titer in the two experiments. (B) Ratio of released infectious test virus and the wild type. Wild-type virus (crosshatched) was set at 1. A delta indicates that the mutation was reverted back to the wild type. Error bars show standard deviations.

