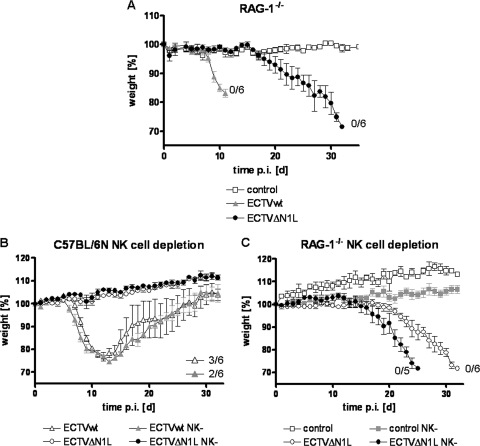
FIG. 7.
Contribution of B, T, and NK cells to the control of ECTVΔN1L infection in mice. (A) Contribution of B and T cells to the control of ECTVΔN1L infection. Groups of five RAG-1−/− mice were mock infected or infected with 200 PFU of the ECTV wt or ECTVΔN1L. Weight, expressed as percent initial body weight, was monitored daily. The standard deviation is given as the SEM. (B) Contribution of NK cells to the control of ECTVΔN1L infection. C57BL/6 mice were depleted of NK cells using a specific monoclonal antibody and afterward mock infected (three animals per group) or infected with 200 PFU of the ECTV wt or ECTVΔN1L (six animals per group). Weight, expressed as percent initial body weight, was monitored daily. The standard deviation is given as the SEM. (C) RAG-1−/− mice were depleted of NK cells and afterward mock infected (three to four animals per group) or infected with 200 PFU of the ECTV wt or ECTVΔN1L (six animals per group). Weight, expressed as percent initial body weight, was monitored daily. The standard deviation is given as the SEM. For all curves, the number of animals that survived the infection of the total number of animals per group is indicated where appropriate. d, days.

