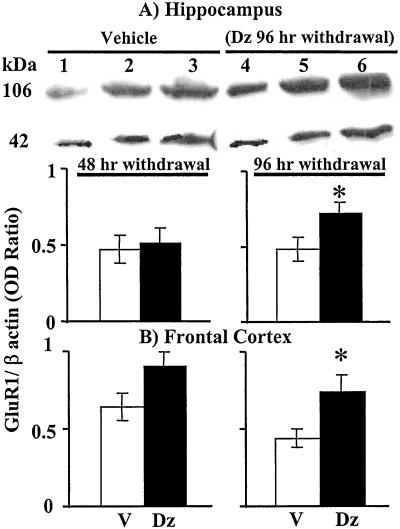
Figure 6.
GluR1 protein expression in hippocampus and frontal cortex following long-term diazepam (Dz)- or vehicle (V)-treatment withdrawal. (A Upper) Representative western blot of crude synaptic membrane extracts prepared from vehicle- or diazepam-withdrawn rats. 106-kDa and 42-kDa bands represent GluR1 and β-actin immunoreactivities, respectively. Lanes 1 and 4 were loaded with 10 μg of proteins, lanes 2 and 5 with 20 μg of protein, and lanes 3 and 6 with 40 μg of protein. (A Lower) Relative levels of GluR1 receptor subunit expressed as the OD ratio with β-actin. (B) Relative levels of GluR1 receptor subunit. Values are the mean ± SE of at least three separate animals. *, P < 0.05 when Dz was compared with the respective V group (ANOVA followed by Duncan's multiple comparison test).

