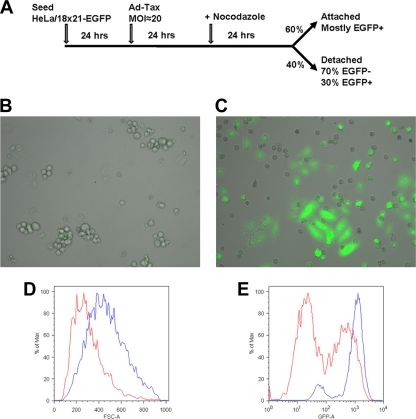
FIG. 1.
Ad-Tax-transduced cells lag in S and G2 phases of the cell cycle. (A) Schematic diagram of the schedules of Ad-Tax transduction and nocodazole treatment. Under the conditions used, 60% of Ad-Tax-transduced cells remained attached to the culture dish after incubation with nocodazole for 24 h. (B and C) Fifty thousand HeLa/18x21-EGFP cells in 1 ml Dulbecco modified Eagle medium (DMEM) containing 10% fetal bovine serum (FBS) and antibiotic supplements were seeded in each well of a six-well plate and then grown at 37°C in 5% CO2 for 24 h. Culture medium was then removed by aspiration and replaced with 1 ml of the same medium with or without Ad-Tax or Ad-tTA. Where appropriate, each well received approximately 2 × 10⁶ PFU of adenovirus vector (final MOI, ≈20). Under this condition, approximately 60% of cells became transduced. The cells were then incubated at 37°C in 5% CO2 for another 24 h. Again, the medium was removed by aspiration and replaced with 1 ml of the same medium containing 100 ng/ml nocodazole, incubated for another 24 h, and then photographed. The photographs are composites that merge both the phase-contrast and the EGFP images. Most, if not all, Ad-tTa-treated cells became round and detached from the culture dish after nocodazole treatment. (C) Ad-Tax-transduced HeLa/18x21-EGFP cells were treated with nocodazole as in panel A. The fractions of Ad-Tax-treated cells that remained attached or detached, respectively, are as detailed for panel A. (D and E) Histograms of cell sizes (D) and EGFP expression (E) as determined by forward light scattering (FSC-A) and fluorescence intensity (GFP-A). Blue and red traces represent, respectively, the attached and detached populations of Ad-Tax-transduced cells after nocodazole treatment.

