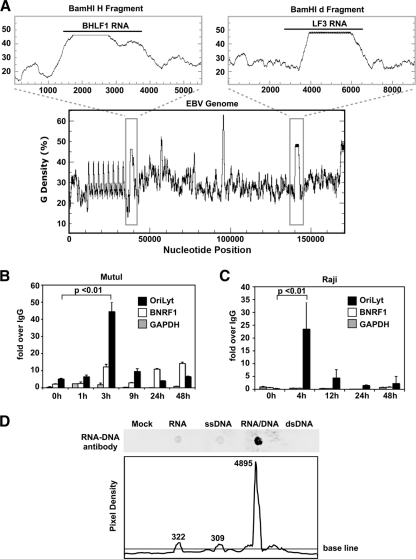
FIG. 4.
An RNA-DNA hybrid is formed at the G-rich BHLF1 region during initiation of lytic replication. (A) The guanine density of the entire EBV genome was plotted using the EMBOSS Freak program (lower plot). The BamHI H and BamHI d fragments, containing the BHLF1 and LF3 genes, respectively (gray boxes), have been enlarged (upper panels). (B and C) Mutu I (B) or Raji (C) cells were treated with or without Na-butyrate and TPA for times (in hours) indicated. DNA was then isolated and analyzed via immunoprecipitation using an antibody specific for RNA-DNA hybrid molecules or an IgG negative control, followed by real-time qPCR using primers for the OriLyt region (black boxes), the BNRF1 transcript region of the virus (white boxes), or the cellular region for GAPDH (gray boxes) as a negative control. Results are shown as the fold enrichment of the RNA-DNA signal over that of the IgG control. Error bars represent the standard deviations of at least three qPCR replicate reactions run side by side. Three identical, independent experiments were conducted; data from one representative experiment are shown. Statistical significance was calculated using a two-tailed, unpaired t test. (D) Nucleotides of various types (as indicated) were annealed, spotted onto a nylon membrane, and probed using the RNA-DNA hybrid antibody to demonstrate antibody specificity (top panel). Pixel density across a horizontal section of the top panel image was calculated using the ImageJ software (NIH). Numerical values indicate integrated densities for each peak.

