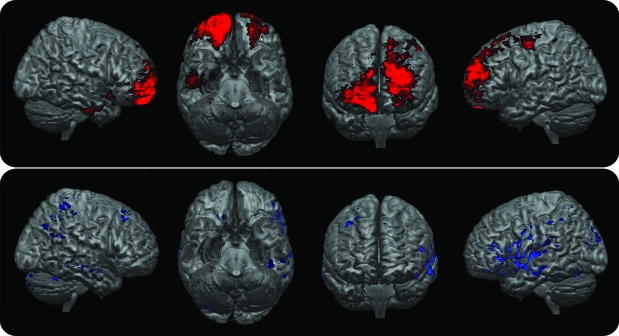
Figure 2. Lesion subtraction map between the aggressive and nonaggressive subjects.
Red blobs represent those areas relatively more lesioned in the aggressive than in the nonaggressive group while the blue blobs represent those areas relatively more lesioned in the nonaggressive than in the aggressive group. Results are overlaid on Montreal Neurological Institute T1 brain standard template. Images in radiologic convention (left side of the brain is represented on the right side of the pictures). A greater likelihood of brain damage in prefrontal areas (especially ventral, medial, and frontopolar regions) can be seen for the aggressive vs nonaggressive group subtraction map.

