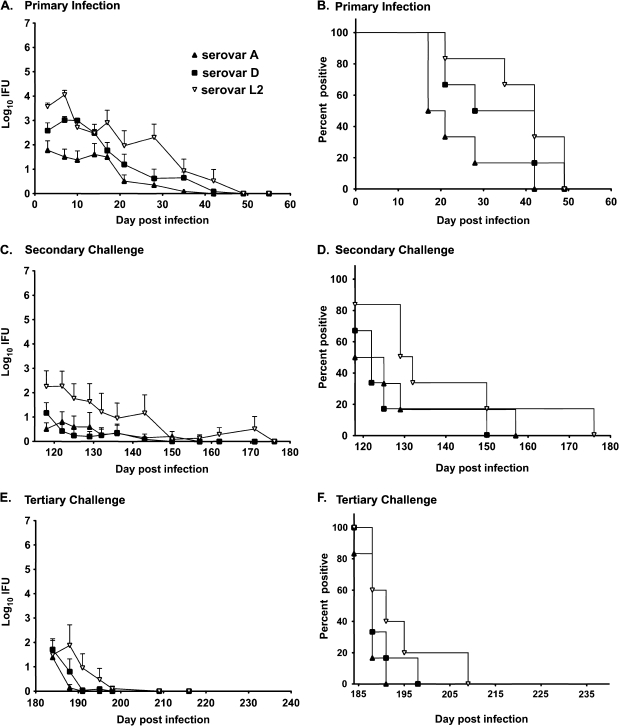
Figure 2.
Course of primary Chlamydia trachomatis genital infection (A and B), and secondary (C and D), and tertiary infectious challenge (E and F) in female C3H/HeJ mice. Medroxyprogesterone acetate–treated mice were challenged vaginally with either C. trachomatis serovar A (▴), D (▪), or L2 (▿), and infection was monitored by enumerating chlamydiae recovered from cervicovaginal swabs. Data are presented as mean inclusion forming units (IFUs) ± standard error of the mean for 6 mice per group (A, C, and E) and as the percentage of culture-positive animals (B, D, and F). “Day post infection” refers to the day following primary infectious challenge. For clarity, we have listed below the various statistical comparisons between the infection curves rather than on the figures. Primary infection curves: for A vs D, P < .01 for days 7 and 10; for A vs L2, P < .001 for days 3, 7, and 28, P < .01 for day 21, and P < .05 for days 10 and 17; for L2 vs D, P < .01 for day 28. Comparison of primary infection (1°) with secondary infection (2°) with the homologous serovar (eg, serovar A primary infections vs serovar A secondary infection): for 1° serovar A vs 2° serovar A, P < .05 for days 3 and 17; for 1° serovar D vs 2° serovar D, P < .001 for days 3, 7, 10, 14 and 17; for 1° serovar L2 vs 2° serovar L2, P was not significant at any time point. For comparison of primary infection vs tertiary infection with the homologous serovar for days 3, 7, 10, and 14 days post infection, P <0.01 for all serovars.

