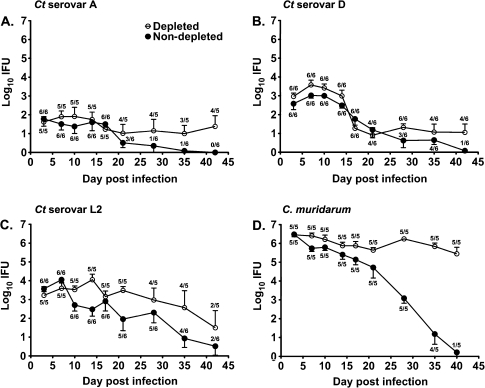
Figure 5.
The course of Chlamydia trachomatis (Ct) serovar A (A), D (B), and L2 (C) or Chlamydia muridarum (D) genital infection in CD4+ T cell–depleted ( ) and nondepleted (•) C3H/HeJ mice. Depleted mice were treated with anti-CD4 prior to and throughout the course of infection. Data are presented as mean inclusion forming units (IFUs) ± standard error of the mean for 5–6 mice per group. The number of culture-positive mice/total mice is indicated for each time point.

