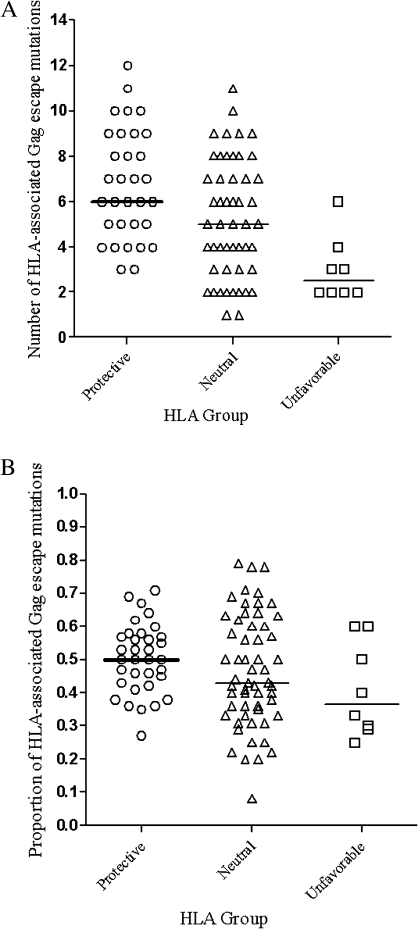
Figure 2.
Number of HLA-associated Gag escape mutations (A) and proportion of HLA-associated Gag polymorphic sites showing escape mutations (B) per person by HLA group. The proportion of escape mutations was calculated as the number of HLA-associated polymorphisms in a viral sequence divided by the total number of possible HLA-associated polymorphic sites for each subject.

