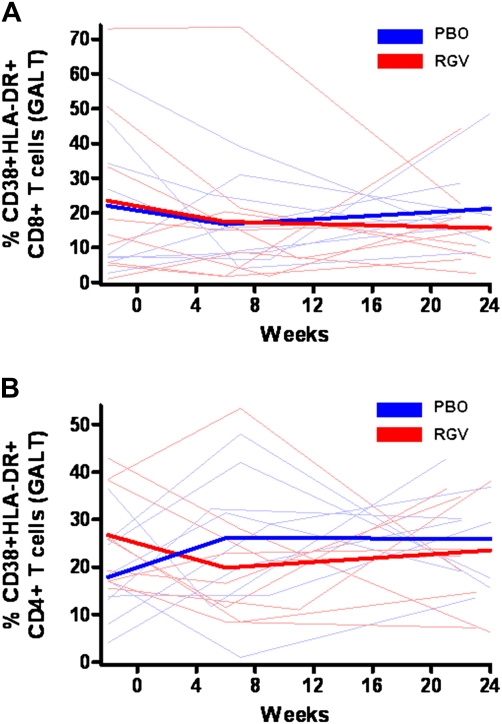
Figure 3.
Percentages of CD38+HLA-DR+CD8+ and CD38+HLA-DR+CD4+ T cells in gut-associated lymphoid tissue (GALT). RGV, raltegravir (red); PBO, placebo (blue). Thin lines represent raw data for each subject; thick lines, estimated mean value over time from generalized estimating equation for each group. Raltegravir intensification had no effect on CD8+ (A) (P = .53) or CD4+ (B) (P = .14) T cell activation in GALT.

