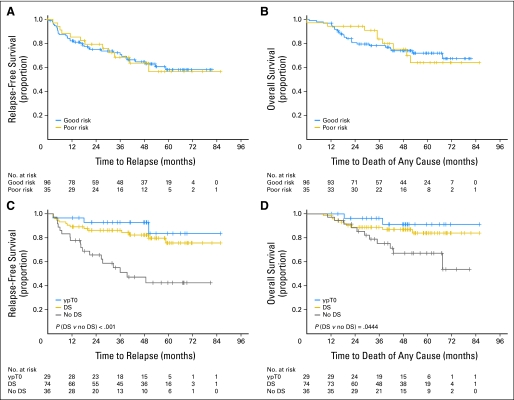
Fig 2.
Kaplan-Meier curves showing (A, C) relapse-free survival and (B, D) overall survival by groups (A, B) and according to the existence of a pathologic complete response (ypT0), a tumor downstaging (DS; including patients with ypT0), or no DS (C, D). A and B include 131 patients; C and D correspond to patients with nonmetastatic disease only (n = 110).

