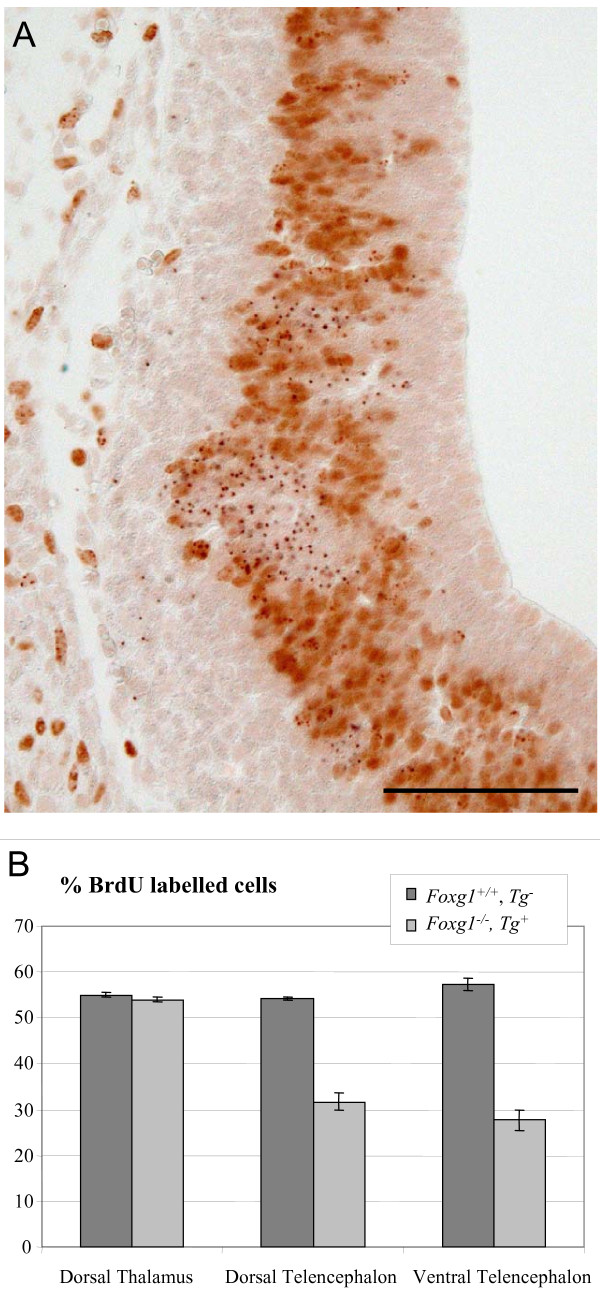
Figure 2.
Foxg1-/- cells display a cell autonomous proliferation defect. (A) Coronal section through the telencephalon of an E12.5 Foxg1+/+;Tg-↔Foxg1-/-;Tg+ chimera showing Tg+ cells (labelled with dark dots) and BrdU+ cells (with brown nuclei). Clusters of BrdU- Tg+ cells are present among BrdU+ Tg- and Tg+ progenitors. Scale bar: 50 μm. (B) Percentages of Tg+ cells in S-phase in the dorsal and ventral telencephalon, but not the dorsal thalamus, of experimental chimeras are significantly lower than the percentages of Tg- cells in S-phase (mean ± s.e.m, n = 3 embryos of each genotype; Student's t-test, P < 0.05).

