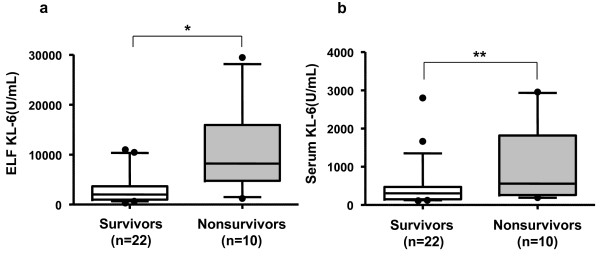
Figure 2.
Comparisons of the highest KL-6 levels in ELF (a) and serum (b) from the serial measurements of the nonsurvivors and survivors. The Box-whisker plots show the 25th and 75th percentiles, the median (horizontal line within the box), and the 10th and 90th percentiles (whiskers). *p = 0.0025, **p = 0.0401 by Mann-Whitney U- test.

