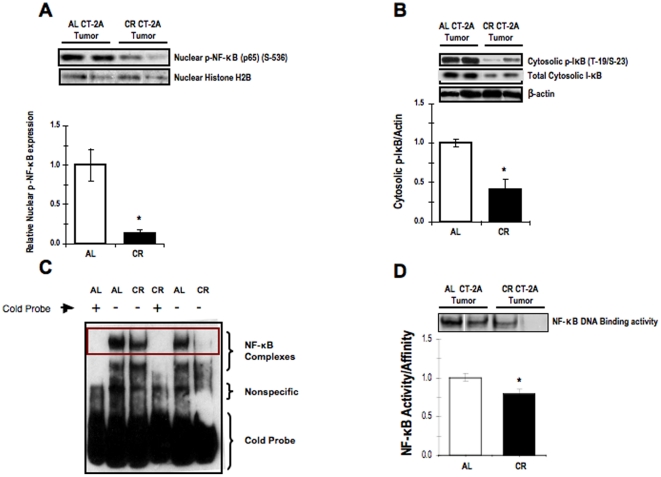
Figure 3. Influence of CR on NF-κB expression and activation in CT-2A astrocytoma.
Nuclear expression of phosphorylated NF-κB (p65) (A); cytosolic expression of phosphorylated IκB and total lκB (B) as assessed by western blot analysis, DNA promoter binding activity of activated NF-κB in the CT-2A astrocytoma (C-D) as assessed by EMSA. The histograms illustrate the average relative expression of phosphorylated to total protein normalized to the indicated loading control in either nuclear or cytoplasmic extracts of the indicated tissue (A-B). Values are expressed as normalized means ± S.E.M of 4–5 independent tissue samples/group. The asterisks in indicate that the value is significantly different in the CT-2A astrocytoma under AL and CR condition at * P<0.05 (Student t-test). Two representative samples are shown for each tissue type. (C) Evaluation of the extent of DNA proinflammatory gene promoter binging activity by activated NF-κB in nuclear extracts of CT-2A under AL and CR condition. (D) Coned-down view of the DNA promoter biding activity of activated NF-κB in nuclear extracts of the NF-κB in the CT-2A astrocytoma under AL and CR condition. The histogram illustrates the average relative expression of activated NF-κB in the indicated tissue. Values are expressed as normalized means ± S.E.M of 4–5 independent tissue samples/group. The asterisks indicate that the value is significantly different in the CT-2A astrocytoma under AL and CR condition at * P<0.05 (Student t-test). Two representative samples are shown for each tissue type.

