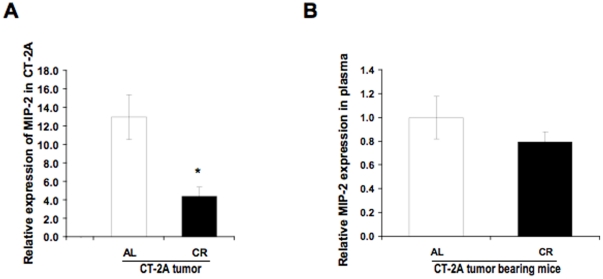
Figure 5. Influence of CR on the Macrophage Inflammatory Protein-2 (MIP-2) concentration.
MIP-2 concentration in brain tumor lysates and in the plasma of mice bearing orthotopically implanted CT-2A tumors as assessed by ELISA. The histograms illustrate the average relative expression of the indicated protein in CT-2A from AL- and CR-fed mice (A). Influence of CR on expression of the indicated protein in the plasma of CT-2A-bearing mice fed AL or CR (B). All values are expressed as means ± S.E.M of 4-5 independent tissues or plasma samples/group. ** P<0.01 indicates that the average MIP-2 level in tumors from the AL-fed group is significantly different from that in tumors from the CR-fed group (Student t-test).

