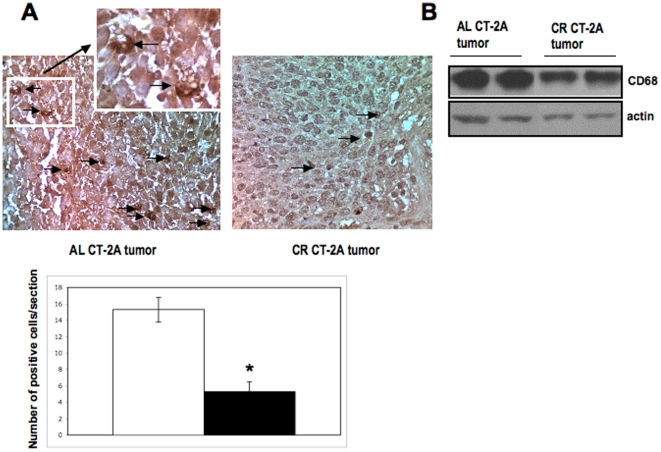
Figure 6. Influence of CR on CD68 expression in CT-2A tumor.
Immunohistochemistry staining shows brown CD68 positive (black arrow) cells at x400 (A). Each section was representative of the entire tumor. All images are produced from digital photograph. The histograms illustrate the average number of brown cells in the entire tumor section at 400× from 3 independent mouse tumors in each group. *P<0.05 indicates that the average CD68 positive cells in tumors from the CR-fed group is significantly less from that in tumors from the AL fed groups. (B) 20 µg of tumor lysates were loaded and incubated with primary CD68 antibody. β-actin was used as loading control. 3 independent samples of each AL and CR group were used.

