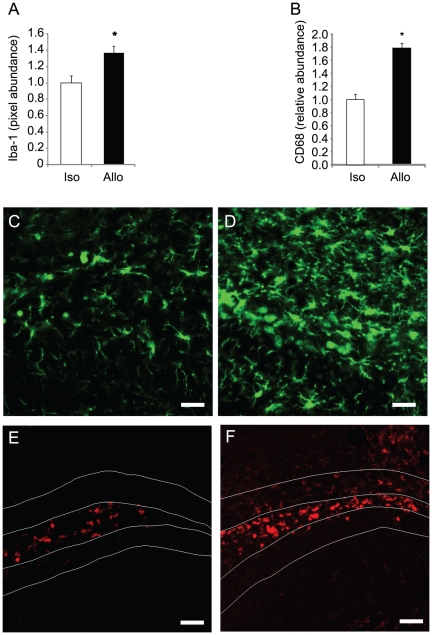
Figure 2. Elevated microglial activation in allografts.
Following NPC transplantation, host microglia were stained for Iba-1 and CD68. (A, B) Iba-1 and CD68 staining increased in allografts relative to isografts indicating an increase in the number and/or hypertrophy of microglia or monocyte lineage cells (*p<0.05, n = 5). (C–F) Representative fluorescent confocal micrographs of isografts (C,E) and allografts (D,F). Iba-1 green in C and D; CD68 red in E and F. Scale bars, 20 µm (C and D) and 50 µm (E and F).

