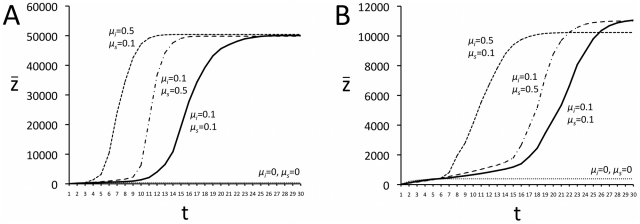
Figure 7. Time series of mean cultural complexity  when ci and cs decrease in proportion to
  according to proportionality constants µi and µs respectively.
In (A) transmission is directly biased, in (B) transmission is indirectly biased. Other parameters: N = 100, ci = 200, cs = 100, λ = 1000, all results are the average of 100 independent runs.

