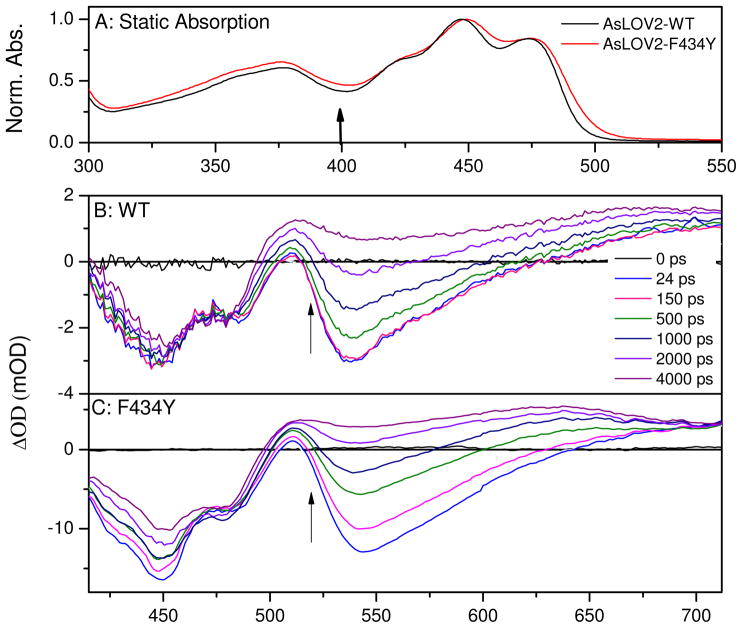
Figure 4.
(A) Normalized absorption spectra of wildtype AsLOV2 (black lines) and F434Y mutant (red line), in 50 mM sodium phosphate buffer (pH 6.0) with 100 mM NaCl. Arrow indicates the excitation wavelength for the transient experiments. Ultrafast transient absorbance spectra of (B) wildtype and (C) F434Y. Arrows indicate transient trend of data as the singlet S1 population evolves to the triplet population. Note: the F434Y mutant exhibits greater transient loss of bleach (<500 nm) signal than the wildtype signals.

