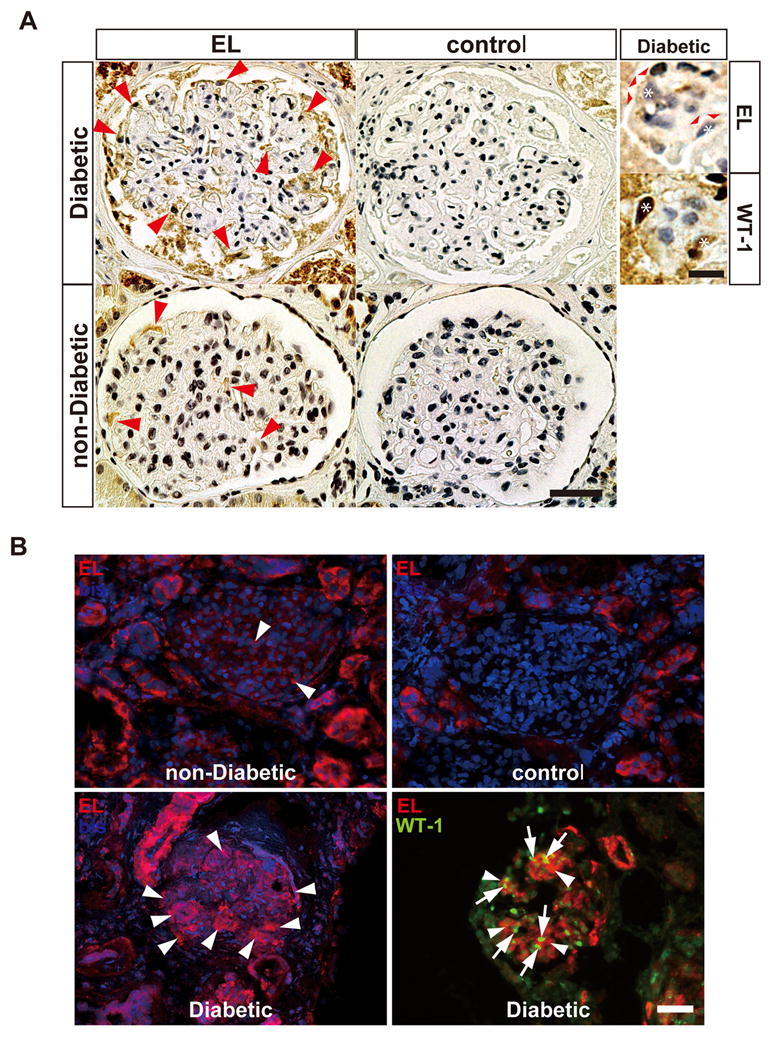
Figure 3.

High endothethelial lipase expression in kidney sections from diabetic patients compared to non-diabetic kidneys. Endothelial Lipase (EL) immunostaining was performed on formalin-fixed paraffin embedded (A) or cryopreserved biopsies (B) from patients with diabetic nephropathy (8) or non-diabetics (7) (see methods). The primary antibody was omitted in the control panel. All diabetic patients except one had increased EL immunopositivity in podocytes. Representative images from 3 diabetic and 2 non-diabetic patients are shown. (A) Immunoperoxidase staining (brown) with anti-EL antibodies show increased EL expression (red arrows) in podocytes and parietal cells of diabetic compared to non-diabetic glomeruli. (scale bar = 50 μm). The high power images on the right (scale bar = 10 μm) are adjacent sections from a diabetic kidney stained with anti-EL or anti-WT-1 (as a podocyte marker) that show colocalization of EL (red arrowheads) and WT-1 (dark brown nuclear staining) in same cells (asterisks) supporting that EL and WT-1 are expressed in the podocytes. (B) EL immunofluorescence (red) on non-diabetic and diabetic kidney tissues also shows increased EL expression in diabetic glomeruli (lower panel), compared to non-diabetic glomeruli (upper panel). Control shows no glomerular staining. WT1 (green nuclear, arrowheads) immunostaining confirms that EL-expressing cells (arrows, cytoplasm) are podocytes. (scale bar = 50 μm). The tubulointerstitial staining is non-specific as it is present in controls in both A and B.
