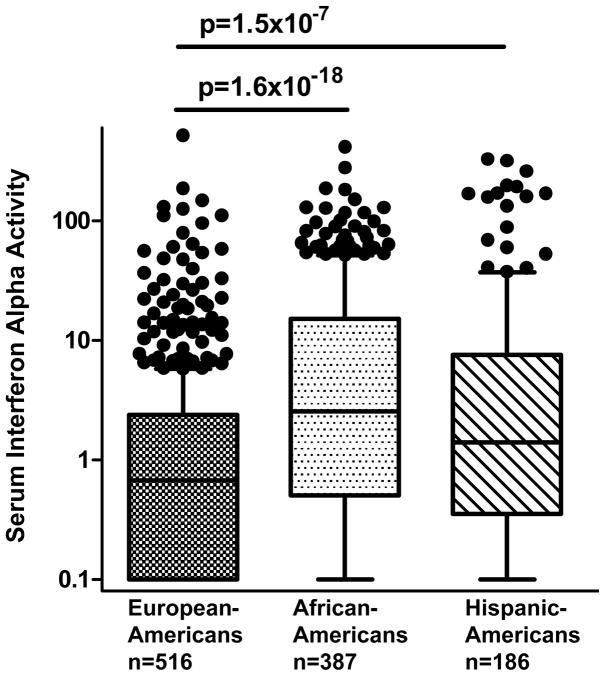
Figure 1.
Serum IFN-α alpha activity in SLE patients stratified by self-reported ancestry. Serum IFN-α activity is represented in relative units on the Y-axis, as described in the Methods. Line is drawn at the median, boxes show the interquartile range, and error bars represent the 90th and 10th percentiles respectively. Two-column t-tests and p-value calculations were done using the non-parametric Mann-Whitney U test.

