
Figure 2.
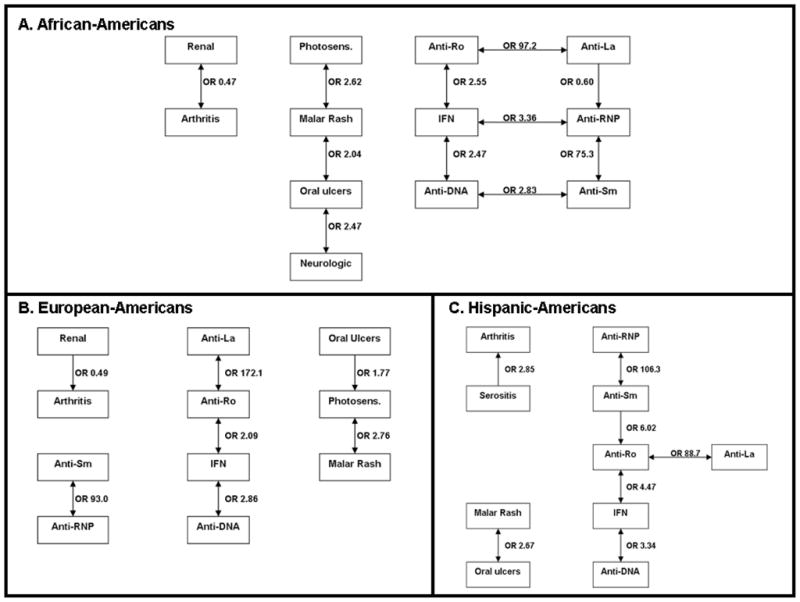
Network diagram showing significant associations between ACR clinical criteria, autoantibodies, and serum IFN-α activity in SLE patients of each ancestral background. A. shows African-American patients, B. shows European-American patients, and C. shows Hispanic-American patients. Each of the boxes indicates the presence of the given feature, and IFN indicates high IFN-α activity, and the odds ratios indicate the direction of the association. Thus, an odds ratio greater than one for an association between “Anti-Ro” and “IFN” means that the presence of anti-Ro antibodies is associated with high IFN-α activity. Connecting lines indicate associations, and arrowheads indicate directionality of the associations (arrowhead touching the box of the outcome variable that is associated with the given predictor variable, most are bidirectional associations). OR = Odds ratio, Photosens. = photosensitivity, anti-DNA = anti-dsDNA