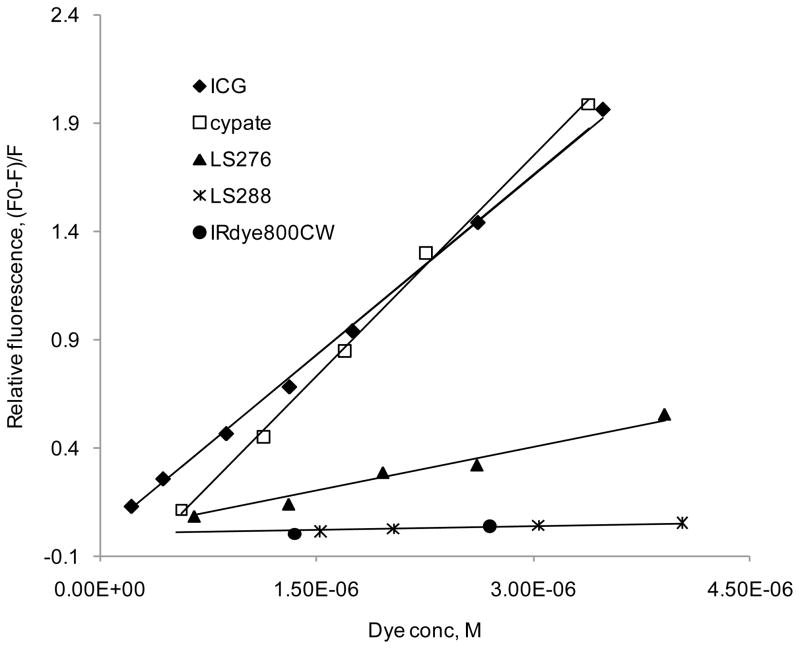
FIGURE 2.
Relative fluorescence as a function of dye concentration (ex/em 279/345nm, BSA conc. 1.4 × 10⁻⁶ M in PBS). Slope of the trend lines corresponds to the binding constants. ICG and cypate possess the strongest binding constant to albumin with values of 554,000 and 556,000 M−1 correspondingly, followed by LS276 (135,000 M−1); LS288 and IRDye800 CW bind the weakest (12,100 and 6,100 M−1 correspondingly).

