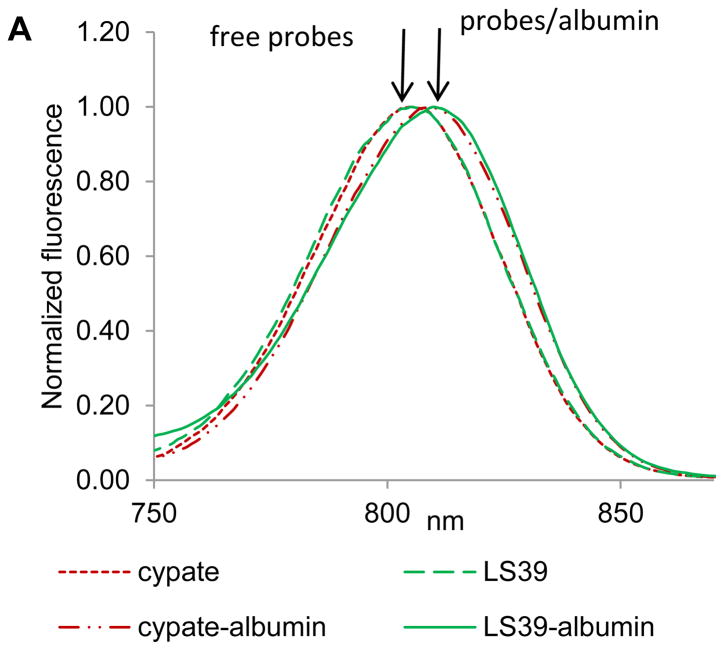
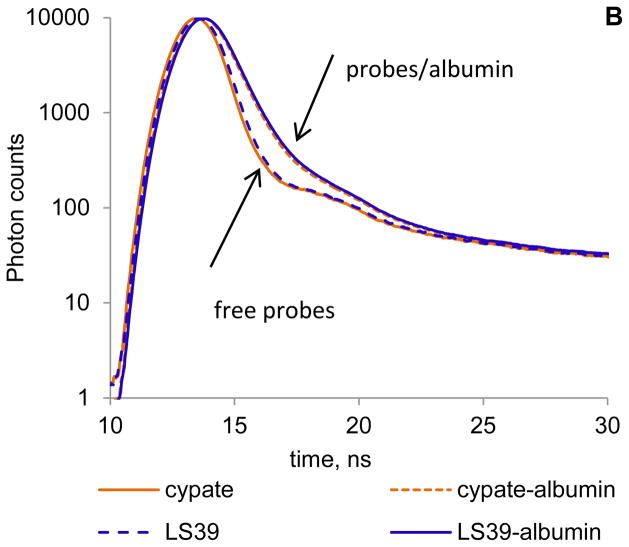
FIGURE 3.
(A) Normalized fluorescence of cypate and LS39 in PBS buffer (free probes) and albumin/PBS buffer (probe/albumin) (ex/em 720/735–900 nm). (B) Fluorescence lifetime decays of probes in PBS buffer (free) and albumin/PBS solution (bound) (ex/em.773/820 nm). Lifetimes: cypate/PBS – 0.18 ns, cypate/PBS/albumin – 0.55 ns average, LS39/PBS – 0.22 ns, LS39/PBS/albumin – 0.57 ns average. Both probes have identical spectra and lifetimes in albumin indicating the same microenvironment around the fluorophore.


