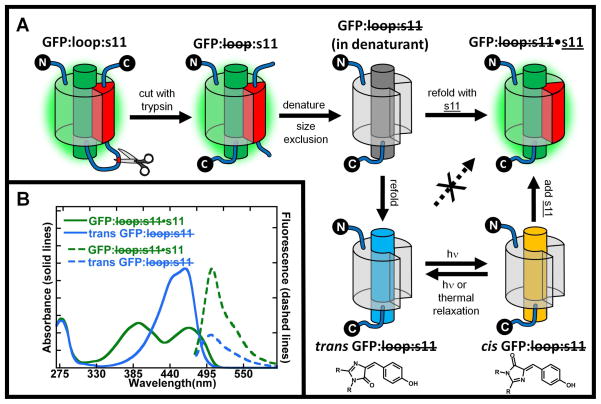
Figure 1.
A) GFP:loop:s11 has a loop containing a proteolytic cleavage site that isolates stave 11 from the rest of the protein and is expressed in high yield with the GFP chromophore formed. This protein is digested with trypsin to make a noncovalent complex GFP: loop:s11, which is then denatured in 6M guanidine hydrochloride to break up the stable noncovalent complex. Size exclusion chromatography then separates GFP: loop:s11 from the native stave 11 in denaturing conditions. When GFP: loop:s11 is diluted out of denaturant in the presence of synthetic strand 11, s11, the GFP: loop:s11•s11 complex is formed, whose absorption and fluorescence spectra are indistinguishable from the original GFP:loop:s11. If, however, GFP: loop:s11 is refolded by itself, in the absence of s11, a new species is formed, denoted trans GFP: loop:s11. Surprisingly, trans GFP: loop:s11 does not non-covalently associate with added s11. If trans GFP: loop:s11 is irradiated, a photostationary state is established between the trans and cis configuration of the chromophore (chromophore structures shown below their cartoon counterparts), and cis GFP: loop:s11 rapidly combines with s11 to form GFP: loop:s11:s11 whose properties are indistinguishable from the original GFP:loop:s11. Note that a β-barrel configuration is shown for GFP: loop:s11 in denaturant, trans GFP: loop:s11 and cis GFP: loop:s11 for purpose of illustration only; the actual structures are not known. B) Absorbance and fluorescence spectra of trans GFP: loop:s11 and GFP: loop:s11•s11. Absorbance spectra of trans GFP: loop:s11 and GFP: loop:s11•s11 are shown by blue and green solid lines, respectively. Fluorescence emission spectra of trans GFP :loop:s11 and GFP: loop:s11•s11 are shown by blue and green dotted lines respectively. The absorbance spectrum of refolded trans GFP: loop:s11 has a single band in the visible region unlike the protein with s11 covalently attached or GFP: loop:s11•s11 (which are indistinguishable). All spectra are normalized by concentration so that the relative intensities of the absorbance spectra reflect differences in extinction coefficients, and the emission spectra relative intensities reflect the difference in extinction coefficient and quantum yield upon excitation at 468nm.

