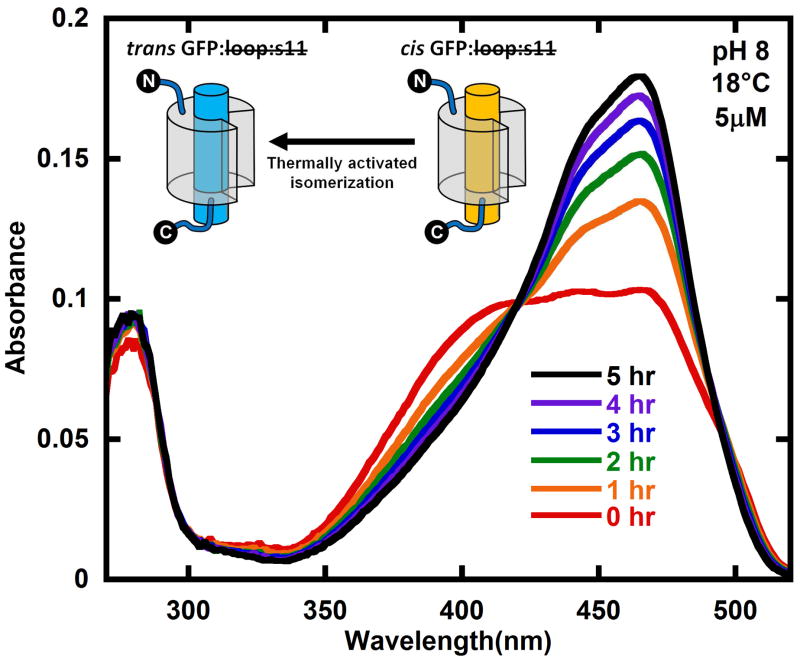
Figure 2.
Reformation of trans GFP: loop:s11 (compare final black spectrum with Figure 1B) in the dark after creating the photostationary state of trans and cis GFP: loop:s11 (red) with 460 nm light. The sample was kept rigorously in the dark and the absorption spectrum sampled infrequently. The cartoons show the part of the kinetic model that describes this data. The protein was at a concentration of 5 μM in pH 8 buffer at 18°C. See Figure 5 for kinetics as a function of temperature.

