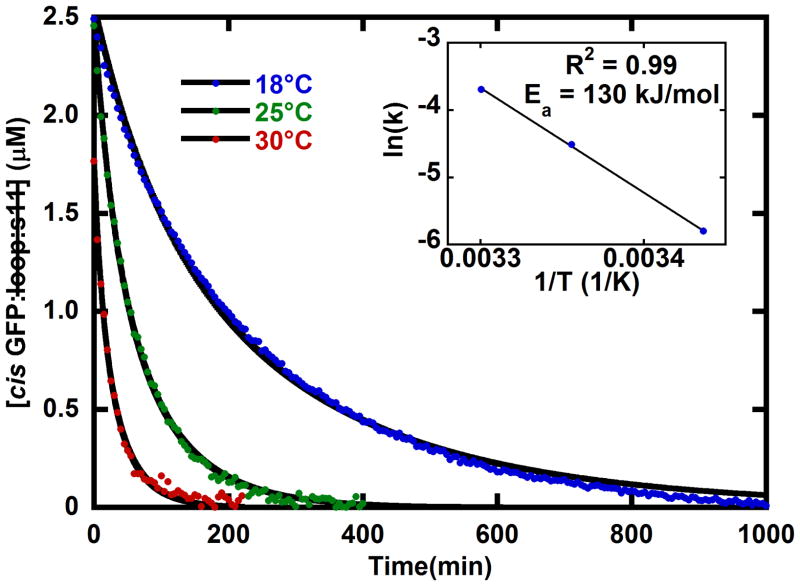
Figure 5.
Temperature dependence of the decay of cis GFP: loop:s11 from the photostationary state to form the more stable trans GFP: loop:s11. The red, green, and blue dots show the concentration decrease in time after the light activated generation of cis GFP: loop:s11 at 30°C, 25°C, and 18°C, respectively. The solid black line fits are obtained from fitting the concentrations of all species with the kinetic model shown in Figure 2 (a unimolecular reaction of cis converting back to trans GFP: loop:s11 and a bimolecular aggregation of cis GFP: loop:s11, see supplementary section). Inset: The temperature dependence shows Arrhenius behavior with an activation energy of 130 kJ/mol. All three samples had a total protein concentration of 5 μM and were in pH 8 buffer.

