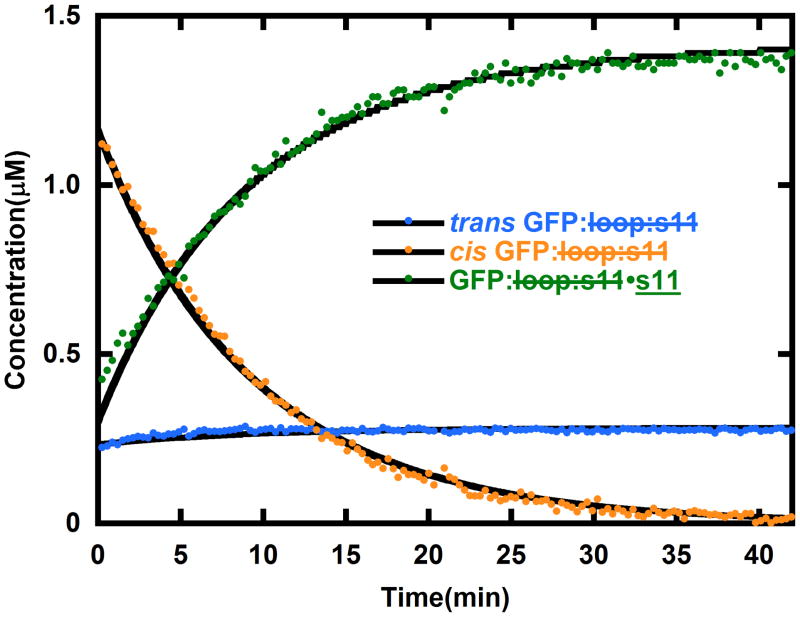
Figure 6.
The evolution of concentrations of trans GFP: loop:s11 (blue), cis GFP: loop:s11 (yellow) and GFP: loop:s11•s11 (green) after generating a photostationary mixture of cis and trans GFP: loop:s11 and mixing in s11. The solid black lines are generated by the model in Figure 3 (a unimolecular reaction of cis converting back to trans GFP: loop:s11, and a bimolecular reaction of s11 forming a complex with cis GFP: loop:s11). As expected from this model the cis GFP: loop:s11 concentration drops as the other species rise, and after the cis GFP: loop:s11 is gone the concentrations of trans GFP: loop:s11 and GFP: loop:s11•s11 remain constant. If the sample is excited with additional light the re-assembly can be driven to completion (data not shown). The initial concentrations of trans GFP: loop:s11 and s11 in this experiment were 2 μM and 10 μM, respectively, and they were in pH 8 buffer at 18°C.

