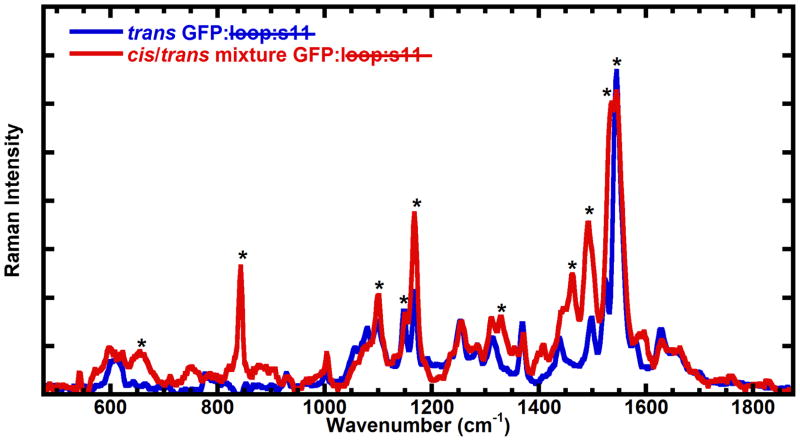
Figure 7.
Raman spectra obtained with 633 nm (pre-resonant) excitation of GFP: loop:s11 at 170K in pH 10 buffer before (trans GFP: loop:s11 in the model) and after light activation (photostationary mixture of trans and cis GFP: loop:s11 in the model, generated with 460 nm light). The starred peaks are consistent with the changes observed in EYQ1 previously except that light activation leads to generation of some chromophore in the cis configuration in this particular case (see text). At the pH these Raman spectra were obtained complete conversion of trans GFP: loop:s11 to cis GFP: loop:s11 is expected to take place (see Figure 8 and discussion), but since the solid was opaque, and the 633 nm light is expected to penetrate deeper into the solid, the spectrum most likely reflects a mixture of cis and trans GFP: loop:s11. The peaks growing in at 850 cm−1, 1260 cm−1, 1450 cm−1, and 1500 cm−1 as well as the decrease of the peak at 1150 cm−1 are consistent with model chromophore Raman spectra.

