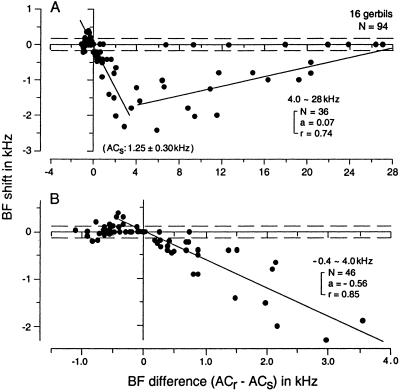
Figure 3.
Shifts in the BFs of 94 cortical neurons in the gerbil evoked by ESar as a function of difference in BF between recorded (ACr) and stimulated cortical auditory neurons (ACs). The BFs of ACs ranged between 0.8 and 2.0 (1.25 ± 0.30) kHz. The data between −1.0 and +4.0 kHz BF differences in A are replotted on the expanded abscissa in B. The solid oblique lines are regression lines for data points (N) in given ranges of BF differences. a, slope; r, correlation coefficient. The horizontal dashed lines indicate one SD. The major BF shifts were centripetal, i.e., toward the BF of ACs.

