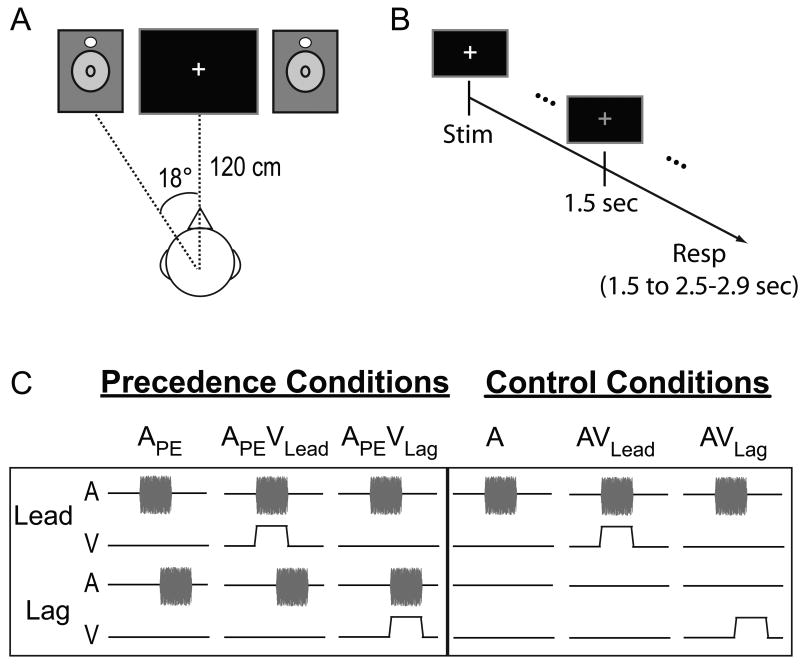
Figure 1.
Apparatus and stimuli. (A) Auditory stimuli were presented from two speakers positioned 18° to the right and left of midline. Visual stimuli were presented via light emitting diodes (LEDs, white circles) suspended just above the speaker cone. Auditory and visual stimuli were 15 msec in duration. (B) Trial structure. Subjects waited 1.5 sec after stimulus presentation to respond. The beginning of the response window was marked by a change from a white to a green fixation cross (shown here as gray). Subjects were given 1.0 – 1.4 sec to respond before the next stimulus presentation. (C) Stimulus conditions. All precedence effect conditions and control conditions are graphically depicted. Temporally leading and lagging auditory pairs were presented alone (APE) or with a visual stimulus spatially and temporally aligned with the leading (APEVLead) or lagging (APEVLag) stimulus. Control conditions included a single noise burst presented alone (A) or with visual stimulation on the same (AVLead) or opposite side (AVLag). Stimulus (Stim), Response (Resp), Auditory (A), Visual (V).

